


Quick Answer: What Is the Variance Formula?
Variance measures how far a set of data values spreads out from the mean. A small variance means the values are close to the mean, while a large variance means the values are more spread out.
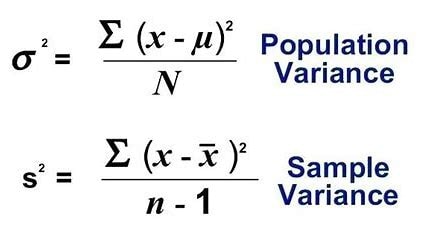
There are two main variance formulas:
| Type of variance | Formula | Use when |
|---|---|---|
| Population variance | σ² = Σ(xᵢ – μ)² / N | You have data for every member of the group |
| Sample variance | s² = Σ(xᵢ – x̄)² / (n – 1) | You have only a sample and want to estimate the population variance |
In these formulas:
Discovering the maths whiz in every child,
that’s what we do.
Suitable for students worldwide, from grades 1 to 12.
Get started free!- xᵢ means each data value
- μ means the population mean
- x̄ means the sample mean
- N means the total number of values in a population
- n means the total number of values in a sample
- Σ means “add them all together”
To calculate variance, find the mean, subtract the mean from each value, square each difference, add the squared differences, and divide by N for population variance or n – 1 for sample variance.
Variance Formula: Population vs Sample
The formula you use depends on whether your data represents an entire population or only a sample.
If you collect the test scores of every student in one class, you can use the population variance formula because you have the full group. If you collect scores from only 20 students to estimate the performance of a much larger grade level, you should use the sample variance formula.
| Feature | Population variance | Sample variance |
|---|---|---|
| Symbol | σ² | s² |
| Mean used | μ | x̄ |
| Denominator | N | n – 1 |
| Best for | Complete data set | Partial data set |
| Common example | Heights of all students in one class | Heights of 30 students chosen from a school |
The most important difference is the denominator. Population variance divides by N, while sample variance divides by n – 1. This adjustment helps a sample give a better estimate of the population’s true variance.
| Population Variance Formula | Sample Variance Formula |
|---|---|
| σ² = Σ(x_i – μ)² / N | s² = Σ(x_i – x̄)² / (n – 1) |
Online Variance Calculator
Step-by-Step Variance Lab
Learn how to calculate Variance & Standard Deviation
| x | (x – mean) | (x – mean)² |
|---|
How to Calculate Variance in 5 Steps?
You can calculate variance by following the same basic steps every time.
Step 1: Find the mean
Add all values together and divide by the number of values.
For the data set 8, 12, 10, 14, 16:
Mean = (8 + 12 + 10 + 14 + 16) / 5
Mean = 60 / 5
Mean = 12
Step 2: Subtract the mean from each value
Find how far each value is from the mean.
| Value | Value – mean |
|---|---|
| 8 | -4 |
| 12 | 0 |
| 10 | -2 |
| 14 | 2 |
| 16 | 4 |
Step 3: Square each difference
Squaring removes negative signs and gives more weight to values that are farther from the mean.
| Value | Difference | Squared difference |
|---|---|---|
| 8 | -4 | 16 |
| 12 | 0 | 0 |
| 10 | -2 | 4 |
| 14 | 2 | 4 |
| 16 | 4 | 16 |
Step 4: Add the squared differences
16 + 0 + 4 + 4 + 16 = 40
The sum of squared differences is 40.
Step 5: Divide by N or n – 1
For population variance:
σ² = 40 / 5 = 8
For sample variance:
s² = 40 / (5 - 1) = 10
So the population variance is 8, and the sample variance is 10.
Population Variance Formula
The population variance formula is:
σ² = Σ(xᵢ - μ)² / N
Use this formula when your data set includes every member of the population you are studying.
Population Variance Example
Suppose five students took a quiz, and these are all the scores in the class:
6, 8, 10, 12, 14
First, find the mean:
μ = (6 + 8 + 10 + 12 + 14) / 5 μ = 50 / 5 μ = 10
Next, subtract the mean and square each difference:
| Score | Score – mean | Squared difference |
|---|---|---|
| 6 | -4 | 16 |
| 8 | -2 | 4 |
| 10 | 0 | 0 |
| 12 | 2 | 4 |
| 14 | 4 | 16 |
Add the squared differences:
16 + 4 + 0 + 4 + 16 = 40
Divide by N:
σ² = 40 / 5 = 8
The population variance is 8.
Sample Variance Formula
The sample variance formula is:
s² = Σ(xᵢ - x̄)² / (n - 1)
Use this formula when your data set is only a sample from a larger population.
Sample Variance Example
A teacher randomly selects five students from a larger grade level and records their test scores:
78, 82, 85, 88, 90
Find the sample mean:
x̄ = (78 + 82 + 85 + 88 + 90) / 5 x̄ = 423 / 5 x̄ = 84.6
Now calculate the squared differences:
| Score | Score – mean | Squared difference |
|---|---|---|
| 78 | -6.6 | 43.56 |
| 82 | -2.6 | 6.76 |
| 85 | 0.4 | 0.16 |
| 88 | 3.4 | 11.56 |
| 90 | 5.4 | 29.16 |
Add the squared differences:
43.56 + 6.76 + 0.16 + 11.56 + 29.16 = 91.2
Divide by n – 1:
s² = 91.2 / (5 - 1) s² = 91.2 / 4 s² = 22.8
The sample variance is 22.8.
Why Does Sample Variance Use n – 1?
Sample variance uses n – 1 because a sample usually underestimates how spread out the full population is.
When you calculate the sample mean, the values in the sample are already centered around that sample mean. This often makes the sample look slightly less spread out than the full population. Dividing by n – 1 instead of n makes the variance a little larger, which helps correct that underestimation.
This adjustment is called Bessel’s correction.
For students, the simple rule is:
- Use N when you have the whole population.
- Use n – 1 when you only have a sample.
Variance vs Standard Deviation
Variance and standard deviation both measure spread, but they are reported in different units.
Variance is measured in squared units. Standard deviation is the square root of variance, so it uses the same units as the original data.
| Measure | Formula | Unit | Meaning |
|---|---|---|---|
| Variance | Average squared distance from the mean | Squared units | Measures overall spread |
| Standard deviation | Square root of variance | Original units | Easier to interpret |
For example, if exam scores have a variance of 25 points squared, the standard deviation is:
√25 = 5
That means scores typically vary by about 5 points from the mean.
Alternative Variance Formula
Another useful formula for variance is:
Var(X) = E(X²) - [E(X)]²
This means:
Variance = mean of the squares - square of the mean
For a data set, the population version can be written as:
σ² = [Σxᵢ² / N] - μ²
This formula is often faster when you already know the sum of the values and the sum of the squared values.
Alternative Formula Example
For the data set:
2, 4, 6
Find the mean:
μ = (2 + 4 + 6) / 3 = 4
Find the mean of the squares:
(2² + 4² + 6²) / 3 = (4 + 16 + 36) / 3 = 56 / 3 = 18.67
Subtract the square of the mean:
18.67 - 4² = 18.67 - 16 = 2.67
The population variance is about 2.67.
Variance Formula for Grouped Data
When data is organized in a frequency table, use the grouped data variance formula.
For population variance:
σ² = Σf(x - μ)² / N
For sample variance:
s² = Σf(x - x̄)² / (n - 1)
In these formulas:
- f means frequency
- x means the value or class midpoint
- μ or x̄ means the mean
- N or n means the total frequency
Grouped Data Example
Suppose the table shows how many students earned each score:
| Score | Frequency |
|---|---|
| 70 | 2 |
| 80 | 3 |
| 90 | 5 |
First, find the mean:
Mean = (70 × 2 + 80 × 3 + 90 × 5) / (2 + 3 + 5)
Mean = (140 + 240 + 450) / 10
Mean = 830 / 10 = 83
Then calculate the squared differences with frequency:
| Score | Frequency | Score – mean | Squared difference | f × squared difference |
|---|---|---|---|---|
| 70 | 2 | -13 | 169 | 338 |
| 80 | 3 | -3 | 9 | 27 |
| 90 | 5 | 7 | 49 | 245 |
Add the weighted squared differences:
338 + 27 + 245 = 610
Population variance:
σ² = 610 / 10 = 61
The population variance is 61.
How to Find Variance in Excel, Google Sheets, and Python
Many students and teachers calculate variance using spreadsheets or programming tools.
Excel and Google Sheets
Use these functions:
| Function | Meaning |
|---|---|
| =VAR.P(A1:A10) | Population variance |
| =VAR.S(A1:A10) | Sample variance |
| =STDEV.P(A1:A10) | Population standard deviation |
| =STDEV.S(A1:A10) | Sample standard deviation |
Use VAR.P when your data is the full population. Use VAR.S when your data is a sample.
Python
In Python, you can use NumPy:
import numpy as np data = [8, 12, 10, 14, 16]
population_variance = np.var(data)
sample_variance = np.var(data, ddof=1) print(population_variance) print(sample_variance)
The ddof=1 setting tells Python to divide by n – 1, which gives the sample variance.
Low Variance vs High Variance
Variance helps you understand whether values are consistent or widely spread out.
| Variance level | What it means | Example |
|---|---|---|
| Low variance | Values are close to the mean | Test scores of 88, 89, 90, 91, 92 |
| High variance | Values are far from the mean | Test scores of 60, 75, 90, 95, 100 |
Low variance often suggests consistency. High variance suggests more variability or less predictability.
For example, two classes may have the same average score, but one class may have much higher variance. That means students in that class performed very differently from one another, even if the average score looks normal.
Common Mistakes When Calculating Variance
Mistake 1: Using n instead of n – 1 for a sample
If your data is a sample, use n – 1 in the denominator. Using n will usually make the variance too small.
Mistake 2: Forgetting to square the differences
If you add the differences without squaring them, positive and negative values can cancel out. Squaring makes every difference positive.
Mistake 3: Confusing variance with standard deviation
Variance is in squared units. Standard deviation is in the original units. If you need an easier real-world interpretation, standard deviation is often more useful.
Mistake 4: Choosing the wrong mean
Use μ for population variance and x̄ for sample variance. The calculation is similar, but the meaning is different.
Discovering the maths whiz in every child,
that’s what we do.
Suitable for students worldwide, from grades 1 to 12.
Get started free!

Nathan, a graduate of the University of New South Wales, brings over 9 years of expertise in teaching Mathematics and Science across primary and secondary levels. Known for his rigorous yet steady instructional style, Nathan has earned high acclaim from students in grades 1-12. He is widely recognized for his unique ability to blend academic rigor with engaging, interactive lessons, making complex concepts accessible and fun for every student.