

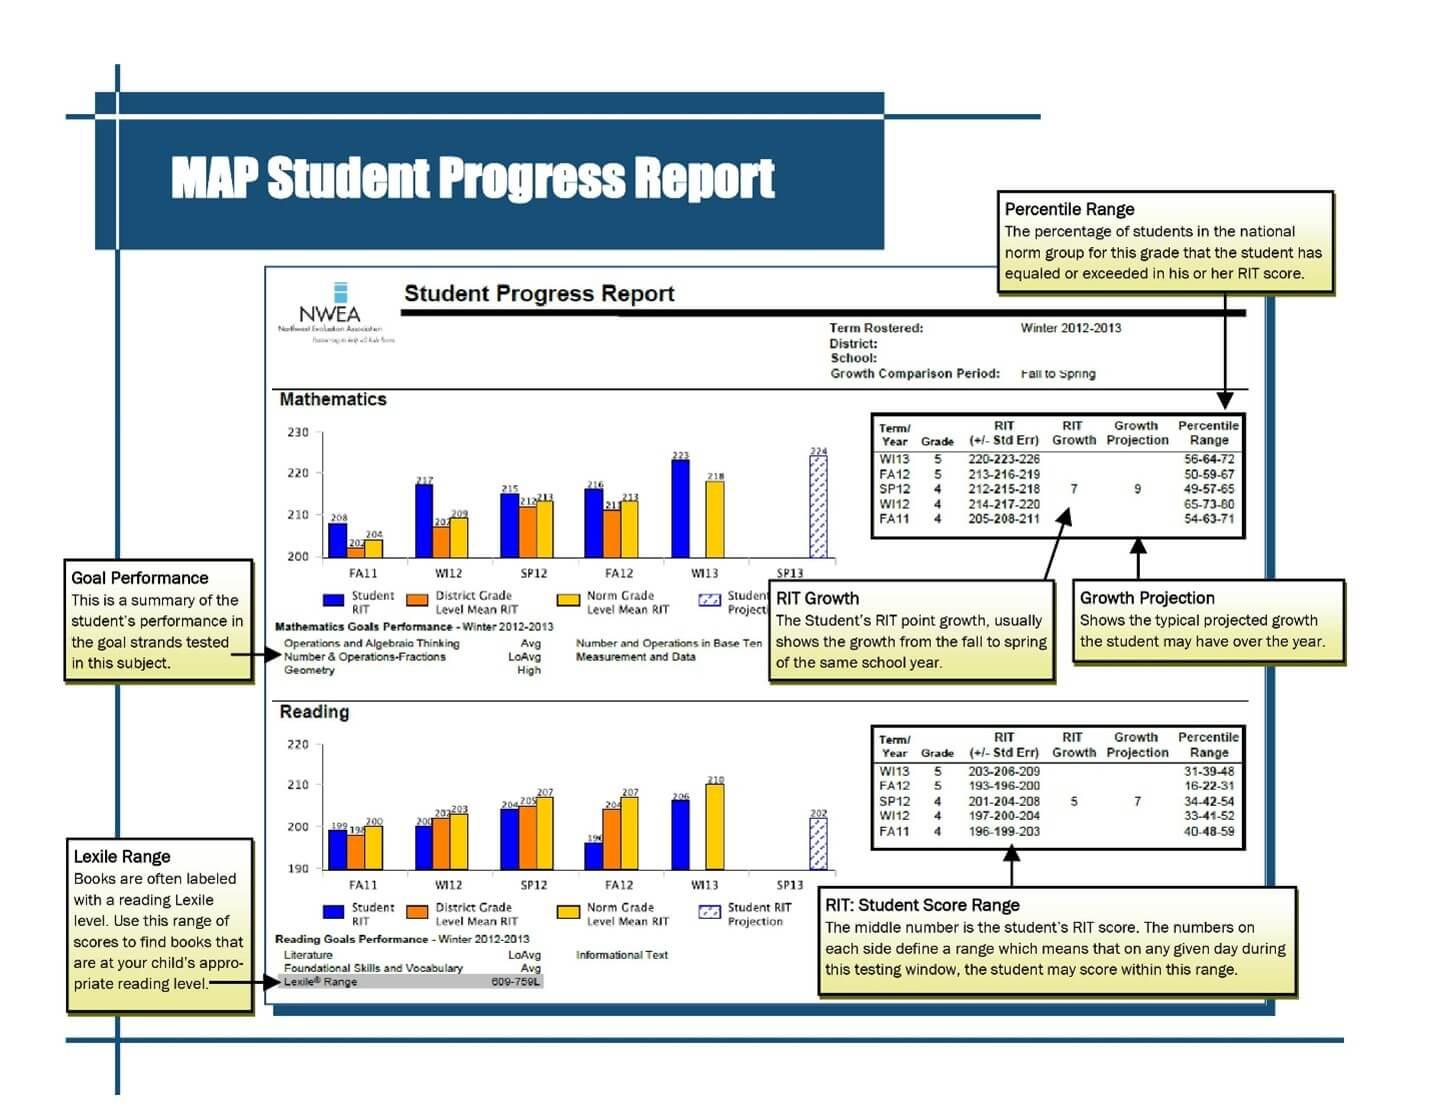
A MAP test scoring chart, often referred to as an NWEA MAP score chart, is a visual representation of a student’s performance on the NWEA MAP (Measures of Academic Progress) test. The chart displays scores using the RIT (Rasch Unit) scale, a consistent, equal-interval measurement of academic achievement that tracks progress over time, independent of grade level.
In this article, WuKong Education will break down the basics of reading a map test scoring chart and provide you with tips to improve your skills. Whether you are a student preparing for an exam or simply interested in improving your map-reading abilities, this guide is for you! So let’s dive in and discover the world of map test scoring charts.
Math is more than numbers; it’s the foundation for logical thinking, creativity, and success in future studies. WuKong Math, trusted by families across 118+ countries, offers online math programs for children aged 3–18 that combine engaging lessons with training. From fundamental skills to international competition prep, our courses make math both fun and empowering for kids.
Discovering the maths whiz in every child,
that’s what we do.
Suitable for students worldwide, from grades 1 to 12.
Get started free!

Part 1: What is Map Test Scoring Chart?
A map test scoring chart is a graphical representation of an individual’s performance on a standardized map test. It displays the test results in various categories, providing an overview of the person’s strengths and weaknesses in different areas.
This chart breaks down map testing scores into subject-specific categories (math, reading, language usage) to highlight strengths and weaknesses. Educators, parents, and students rely on it to compare performance against national norms, set learning goals, and monitor progress—especially when referencing map scores by grade level 2025 for up-to-date benchmarks.
It can also be useful for identifying patterns or trends in test scores over time. Overall, a map test scoring chart serves as an essential tool for analyzing and interpreting map test results accurately and efficiently. So, it is crucial to understand how to read and interpret this type of chart properly.
Part 2: Map Testing Scores Chart 2025
Map testing scores chart 2025 reading is a visual representation of a student’s performance on the standardized map test in the year 2025.
It provides an overview of the test results, breaking them down into different categories to showcase strengths and weaknesses in various areas. This type of chart is widely used in educational settings to help students and educators understand their progress over time.
The map testing scores chart 2025 reading is a valuable tool for tracking performance and identifying areas for improvement. By analyzing and interpreting this chart, individuals can gain insights into their reading abilities and make informed decisions about how to improve their skills.
Map Scores by Grade Level 2025
| Achievement Tier | Mathematics (RIT) | Reading (RIT) | Percentile |
|---|---|---|---|
| Higher Achievement | 160 | 157 | 95 |
| 152 | 149 | 84 | |
| 146 | 143 | 69 | |
| Median and Mean | 140 | 137 | 50 |
| Lower Achievement | 133 | 131 | 31 |
| 127 | 124 | 16 | |
| 119 | 117 | 2 |
1st–12th Grade: Key Map Testing Scores by Grade Level 2025 (Median & 95th Percentile)
For a quick reference, here are the median (50th percentile) and high-achievement (95th percentile) map testing scores by grade level 2025:
| Grade | Math (Median) | Math (95th Percentile) | Reading (Median) | Reading (95th Percentile) | Language Usage (Median) | Language Usage (95th Percentile) |
|---|---|---|---|---|---|---|
| 1 | 160 | 181 | 156 | 177 | – | – |
| 2 | 175 | 196 | 172 | 197 | 174 | 200 |
| 3 | 188 | 211 | 187 | 214 | 188 | 213 |
| 4 | 200 | 223 | 197 | 224 | 197 | 222 |
| 5 | 209 | 234 | 204 | 231 | 204 | 228 |
| 6 | 215 | 241 | 210 | 237 | 209 | 233 |
| 7 | 220 | 249 | 214 | 241 | 213 | 237 |
| 8 | 225 | 256 | 218 | 246 | 216 | 240 |
| 9 | 226 | 259 | 217 | 250 | 219 | 242 |
| 10 | 229 | 262 | 221 | 251 | 219 | 244 |
| 11 | 232 | 266 | 224 | 253 | 221 | 245 |
| 12 | 223 | 269 | 224 | 256 | – | – |
Part 3: Interpreting the RIT Score


Each RIT score corresponds to a student’s performance level on a specific subject. For example, in mathematics, a RIT score of 220 for a 5th grader indicates they are performing at, above, or below the average for their grade level, depending on the normed data. The 2025 scoring chart provides detailed percentiles, allowing parents to see how their child compares to peers nationally. If your child’s math RIT score suggests room for improvement, consider enrolling them in specialized programs like WuKong Math, online math class for kids, which offers personalized instruction to boost mathematical skills and confidence.
Discovering the maths whiz in every child,
that’s what we do.
Book for free now, get Map test preparation advice from professional math teachers
Get started free!Part 4: What is a Gifted Map Score?
A gifted map score is a test score that falls within the “gifted” range on a map test scoring chart. This score indicates that an individual has achieved a high level of performance on the standardized map test, demonstrating advanced skills and knowledge in various areas. Below are the gifted map scores by grade level 2025.
| Grade | Mathematics (RIT Range) | Reading (RIT Range) | Language Usage (RIT Range) |
|---|---|---|---|
| K | 152–160 | 149–157 | – |
| 1 | 172–181 | 169–177 | – |
| 2 | 188–196 | 187–197 | 190–200 |
| 3 | 202–211 | 203–214 | 203–213 |
| 4 | 214–223 | 213–224 | 212–222 |
| 5 | 224–234 | 221–231 | 219–228 |
| 6 | 231–241 | 227–237 | 224–233 |
| 7 | 238–249 | 231–241 | 227–237 |
| 8 | 244–256 | 235–246 | 230–240 |
| 9 | 246–259 | 238–250 | 232–242 |
| 10 | 249–262 | 239–251 | 234–244 |
| 11 | 252–266 | 241–253 | 236–245 |
Gifted scores are typically represented by a different color or symbol on the map test scoring chart, making them easy to identify. This type of score is often used to identify students who may benefit from advanced or accelerated learning opportunities. It can also serve as a source of motivation for individuals, encouraging them to continue striving for excellence in their academic pursuits.
Part 5: How to Find the NWEA Map Scores?

NWEA Map scores are an important tool used to measure student performance on standardized map tests.
These scores can provide valuable insights into a student’s strengths and areas for improvement, helping educators tailor instruction to meet the individual needs of each student. But how exactly can you find these scores?
Fortunately, there are several ways to access NWEA Map scores, including through the NWEA website, student reports, and district or school-level reports.
Additionally, educators can use NWEA’s MAP Growth instructional resources to track individual student growth over time and make data-driven decisions for classroom instruction. For more detailed information, please read NWEA MAP Test Scores Chart 2023 to 2025 by Grade Level.
How to Improve Map Testing Scores
To boost map testing scores and align with map scores by grade level 2025 goals, follow these strategies:
1. Target Weak Areas
Use map testing scores reports to identify gaps (e.g., a 4th grader with a 192 RIT in math may need extra practice in algebra). Focus on skill-specific drills (e.g., fractions, geometry) rather than general review.
2. Practice with Adaptive Tools
MAP is an adaptive test, so practice with adaptive resources (e.g., NWEA’s MAP Growth practice tests) to build familiarity with question difficulty shifts.
3. Create a Study Schedule
Break study sessions into 20–30 minute blocks (e.g., 3x/week for math) and track progress against map scores by grade level 2025 benchmarks. Celebrate small wins (e.g., a +5 RIT increase).
4. Collaborate with Teachers
Ask educators for personalized resources (e.g., worksheets, apps) tailored to your child’s map testing scores gaps. Teachers can also explain how to align practice with grade-level standards.
FAQs About Map Test Scoring Charts:
There are a few different ways to check map scores by grade level. One option is to access district or school-level reports that provide an overview of student performance in each grade.
Another option is to use the NWEA website, which allows educators to search for specific students and view their test scores by grade level.
To read a map test scores chart, start by looking at the overall score or composite score, which is usually located at the top of the chart. This score represents an individual’s performance on the entire map test and provides a general overview of their abilities.
Pay attention to the different categories and their corresponding scores to understand your strengths and weaknesses in each area.
The maximum RIT score is 350 for most subjects, but it’s extremely rare. Map testing scores prioritize growth over reaching a “max”—focus on beating your child’s previous RIT score.
Summary:
A map test scoring chart is an essential tool for understanding and analyzing standardized map test results. It provides a visual representation of an individual’s performance in different categories, allowing for a more comprehensive evaluation of strengths and weaknesses.
Whether you are a student or an educator, understanding how to read a map test scoring chart is crucial for using this valuable tool effectively. So, utilize the tips and information provided in this article to better understand and interpret map test scoring charts.
Follow WuKong Math to learn more about mathematics.
WuKong Math: Unlock Your Child’s Math Potential and Global Mindset
Whether your child is building a solid foundation or aiming for top international awards, WuKong Math offers full-spectrum support:
- World-Class Teachers: We recruit only the top 1% of educators worldwide. 81% hold Master’s degrees, with an average of 8 years’ teaching experience.
- International Curriculum: 10 progressive levels covering 4 major global math competitions, tailored to students of different grades, countries, and learning backgrounds.
- Innovative Teaching Method: Based on Singapore’s CPA modeling approach, we guide students from concrete to abstract thinking, fostering creative problem-solving skills.
- Risk-Free Start: Enjoy a free trial class plus a personalized study plan. High-value, flexible online learning empowers your child to take the lead and achieve math excellence.
Discovering the maths whiz in every child,
that’s what we do.
Suitable for students worldwide, from grades 1 to 12.
Get started free!

Graduated from Columbia University in the United States and has rich practical experience in mathematics competitions’ teaching, including Math Kangaroo, AMC… He teaches students the ways to flexible thinking and quick thinking in sloving math questions, and he is good at inspiring and guiding students to think about mathematical problems and find solutions.