

How to Read a MAP Test Scoring Chart (2026 Update: New 2025 NWEA Norms)


A MAP test scoring chart converts a student’s raw NWEA MAP Growth test results into a RIT (Rasch Unit) score — an equal-interval scale from roughly 100 to 300 that measures academic achievement independent of grade level. The chart pairs each RIT score with a percentile rank showing how that score compares to a national norm group in the same grade, subject, and testing season (fall, winter, or spring).
In August 2025, NWEA replaced the 2020 norm tables with new 2025 norms, so the same RIT score a student earns today may now map to a different percentile than it did last year — the RIT scale itself hasn’t changed, but the comparison group has.
Online Tool to Read MAP Test Scoring Chart
MAP Test Score Evaluator
Compare your RIT score with 2020 National Norms
What is Map Test Scoring Chart?
A map test scoring chart is a graphical representation of an individual's performance on a standardized map test. It displays the test results in various categories, providing an overview of the person's strengths and weaknesses in different areas.
Discovering the maths whiz in every child,
that's what we do.
Suitable for students worldwide, from grades K-12.
Get started free!This chart breaks down map testing scores into subject-specific categories (math, reading, language usage) to highlight strengths and weaknesses. Educators, parents, and students rely on it to compare performance against national norms, set learning goals, and monitor progress—especially when referencing map scores by grade level 2026 for up-to-date benchmarks.
It can also be useful for identifying patterns or trends in test scores over time. Overall, a map test scoring chart serves as an essential tool for analyzing and interpreting map test results accurately and efficiently. So, it is crucial to understand how to read and interpret this type of chart properly.
NWEA Updated Its MAP Growth Norms in 2025 What Actually Changed
NWEA released updated MAP Growth achievement and growth norms in August 2025, replacing the 2020 norms that most existing MAP scoring charts (including older versions of this one) were built on. Districts are phasing the new norms into student reports through the 2025–2026 school year, so a family might see either norm set depending on when their school transitioned. Three things matter for reading a chart correctly right now:
- The RIT scale did not change. A RIT score of 220 in 5th-grade math still means the same thing it always did — it's a stable, equal-interval measure of achievement.
- The percentile a RIT score maps to did change, because NWEA re-normed against a fresh national sample of roughly 13.8 million students across 30,000 schools, collected through 2024 rather than 2020.
- The shift isn't uniform. NWEA's own analysis shows the biggest changes are at the lower end of the achievement range, especially in reading and language usage; math shows a more mixed pattern, particularly for higher-achieving students; and science stayed the most stable of the four subjects.
The 2025 Norms Rule of Thumb: as a general pattern, the same RIT score now corresponds to a higher percentile than it did under the 2020 norms, because national achievement shifted downward and grew more variable — consistent with NWEA's post-pandemic research. NWEA's own worked example: a 5th-grade reading score that placed a student at the 50th percentile under the 2020 norms now places that same RIT score at roughly the 56th percentile under the 2025 norms. Conversely, if you're trying to find the RIT score that corresponds to a specific percentile (say, a 30th-percentile intervention cutoff), that RIT number will typically be lower under the 2025 norms than it was under 2020.
Practical takeaway
If your child's percentile jumped several points but the RIT score barely moved, that's very likely a norms artifact, not a sudden change in ability. Compare RIT-to-RIT across testing terms to track real growth, and treat percentile comparisons as valid only within the same norm year.
Map Testing Scores Chart 2026
2020 National Norms Reference Table
The table below uses the 2020 norms, which many districts' historical reports and growth comparisons still reference, so it remains a useful baseline. Because your school may already be reporting under the 2025 norms, check your child's official score report to see which norm year it cites before comparing against this table directly.
| Achievement Tier | Mathematics (RIT) | Reading (RIT) | Percentile |
|---|---|---|---|
| Higher Achievement | 160 | 157 | 95 |
| 152 | 149 | 84 | |
| 146 | 143 | 69 | |
| Median and Mean | 140 | 137 | 50 |
| Lower Achievement | 133 | 131 | 31 |
| 127 | 124 | 16 | |
| 119 | 117 | 2 |
MAP Testing Scores by Grade, 1st–12th (Median & 95th Percentile, 2020 Norms)
For a quick reference, here are the median (50th percentile) and high-achievement (95th percentile) map testing scores chart 2026 reading:
| Grade | Math (Median) | Math (95th Percentile) | Reading (Median) | Reading (95th Percentile) | Language Usage (Median) | Language Usage (95th Percentile) |
|---|---|---|---|---|---|---|
| 1 | 160 | 181 | 156 | 177 | – | – |
| 2 | 175 | 196 | 172 | 197 | 174 | 200 |
| 3 | 188 | 211 | 187 | 214 | 188 | 213 |
| 4 | 200 | 223 | 197 | 224 | 197 | 222 |
| 5 | 209 | 234 | 204 | 231 | 204 | 228 |
| 6 | 215 | 241 | 210 | 237 | 209 | 233 |
| 7 | 220 | 249 | 214 | 241 | 213 | 237 |
| 8 | 225 | 256 | 218 | 246 | 216 | 240 |
| 9 | 226 | 259 | 217 | 250 | 219 | 242 |
| 10 | 229 | 262 | 221 | 251 | 219 | 244 |
| 11 | 232 | 266 | 224 | 253 | 221 | 245 |
| 12 | 223 | 269 | 224 | 256 | – | – |
How to Interpret a Student's RIT Score

A RIT score only becomes meaningful next to two reference points: the norm table for that grade/subject/season, and the student's own prior RIT scores over time. For example, a 5th grader with a math RIT of 220 sits close to the 2020-norms median of 209, meaning above-average achievement for that grade under that norm set, but under the 2025 norms, that same 220 could correspond to a somewhat different percentile, since math shows one of the more mixed shift patterns among the four tested subjects. Because of this, growth (this term's RIT minus last term's RIT) is now the more norm-year-proof way to judge progress than a single percentile snapshot.
If a RIT score suggests room for improvement, targeted instruction — such as WuKong Math's online math classes for kids — can address specific skill gaps rather than general review.
What is a Gifted Map Score?
A gifted map score is a test score that falls within the "gifted" range on a map test scoring chart. This score indicates that an individual has achieved a high level of performance on the standardized map test, demonstrating advanced skills and knowledge in various areas. Below are the gifted map scores by grade level 2026.
| Grade | Mathematics (RIT Range) | Reading (RIT Range) | Language Usage (RIT Range) |
|---|---|---|---|
| K | 152–160 | 149–157 | – |
| 1 | 172–181 | 169–177 | – |
| 2 | 188–196 | 187–197 | 190–200 |
| 3 | 202–211 | 203–214 | 203–213 |
| 4 | 214–223 | 213–224 | 212–222 |
| 5 | 224–234 | 221–231 | 219–228 |
| 6 | 231–241 | 227–237 | 224–233 |
| 7 | 238–249 | 231–241 | 227–237 |
| 8 | 244–256 | 235–246 | 230–240 |
| 9 | 246–259 | 238–250 | 232–242 |
| 10 | 249–262 | 239–251 | 234–244 |
| 11 | 252–266 | 241–253 | 236–245 |
Gifted scores are typically represented by a different color or symbol on the map test scoring chart, making them easy to identify. This type of score is often used to identify students who may benefit from advanced or accelerated learning opportunities. It can also serve as a source of motivation for individuals, encouraging them to continue striving for excellence in their academic pursuits.
How to Read the ±SE and Percentile Ranges on a Report
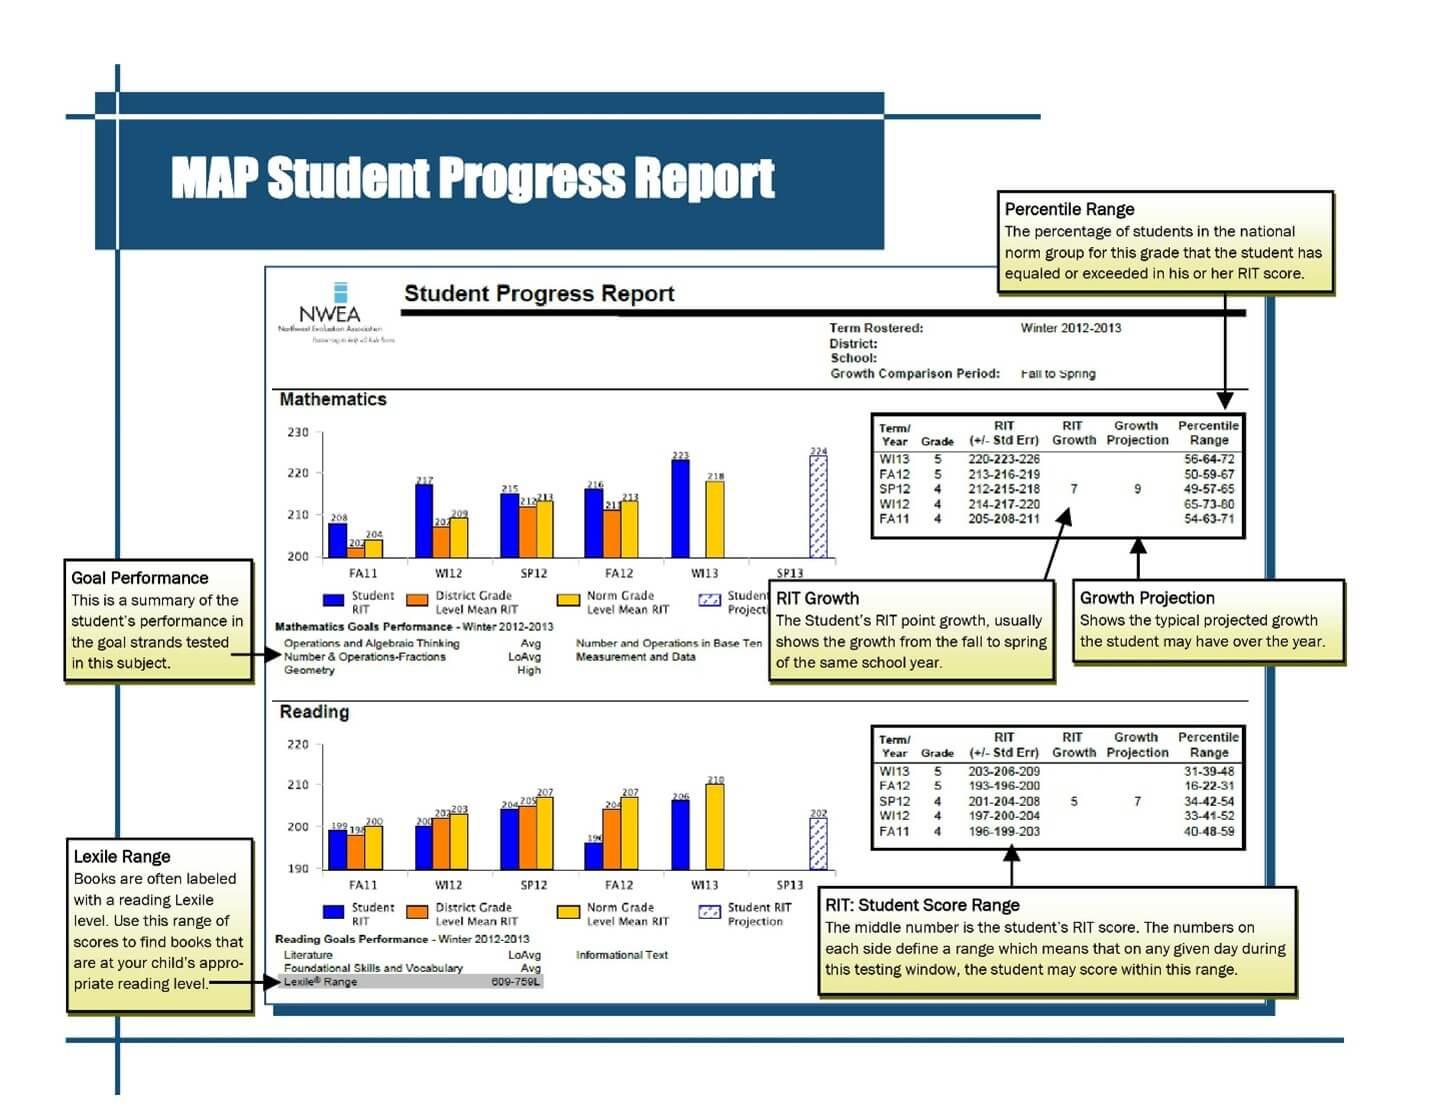
A MAP report shows RIT as three numbers, e.g. 207–210–213: the middle number (210) is the actual score; the outer two mark the range the student would likely fall into on a retake, due to standard measurement error. Percentile is shown the same way — e.g. 25–32–39 means the student scored better than 32% of peers, with a realistic retake range of 25th–39th percentile. Treat single scores as a range, not a fixed number, and rely on multi-term trends over any one test.
Growth, separately, is just the RIT difference between two terms (e.g., Fall 190 → Spring 205 = +15 RIT growth), compared against NWEA's grade-specific growth norm for that starting score.
MAP Norms by Grade: Percentile Chart (K–12)
Each table shows the RIT score at each percentile band for that grade, based on NWEA's published achievement norms. "–" means no norms data exists for that grade/subject.
Kindergarten
| Percentile | Math | Reading |
|---|---|---|
| 95 | 161 | 153 |
| 85 | 154 | 148 |
| 65 | 146 | 142 |
| 50 (median) | 141 | 138 |
| 35 | 136 | 134 |
| 15 | 128 | 128 |
| 5 | 121 | 123 |
Grade 1
| Percentile | Math | Reading |
|---|---|---|
| 95 | 181 | 177 |
| 85 | 173 | 169 |
| 65 | 164 | 160 |
| 50 (median) | 159 | 155 |
| 35 | 154 | 150 |
| 15 | 145 | 142 |
| 5 | 137 | 134 |
Grade 2
| Percentile | Math | Reading | Language Usage | Science |
|---|---|---|---|---|
| 95 | 198 | 182 | 198 | 199 |
| 85 | 189 | 178 | 188 | 190 |
| 65 | 179 | 173 | 177 | 182 |
| 50 (median) | 173 | 170 | 170 | 176 |
| 35 | 167 | 163 | 164 | 171 |
| 15 | 157 | 152 | 153 | 162 |
| 5 | 147 | 142 | 143 | 154 |
Grade 3
| Percentile | Math | Reading | Language Usage | Science |
|---|---|---|---|---|
| 95 | 210 | 215 | 213 | 209 |
| 85 | 200 | 204 | 202 | 201 |
| 65 | 190 | 192 | 191 | 192 |
| 50 (median) | 184 | 185 | 184 | 187 |
| 35 | 178 | 178 | 178 | 182 |
| 15 | 168 | 166 | 166 | 173 |
| 5 | 158 | 155 | 156 | 165 |
Grade 4
| Percentile | Math | Reading | Language Usage | Science |
|---|---|---|---|---|
| 95 | 223 | 226 | 222 | 216 |
| 85 | 214 | 215 | 212 | 208 |
| 65 | 203 | 203 | 201 | 200 |
| 50 (median) | 197 | 196 | 195 | 195 |
| 35 | 191 | 189 | 188 | 190 |
| 15 | 181 | 177 | 177 | 181 |
| 5 | 171 | 166 | 167 | 174 |
Grade 5
| Percentile | Math | Reading | Language Usage | Science |
|---|---|---|---|---|
| 95 | 233 | 232 | 228 | 223 |
| 85 | 223 | 222 | 219 | 215 |
| 65 | 212 | 210 | 208 | 206 |
| 50 (median) | 206 | 204 | 202 | 201 |
| 35 | 200 | 197 | 196 | 196 |
| 15 | 189 | 186 | 185 | 187 |
| 5 | 180 | 175 | 175 | 179 |
Grade 6
| Percentile | Math | Reading | Language Usage | Science |
|---|---|---|---|---|
| 95 | 237 | 237 | 232 | 226 |
| 85 | 227 | 226 | 223 | 218 |
| 65 | 216 | 215 | 213 | 209 |
| 50 (median) | 210 | 209 | 206 | 204 |
| 35 | 204 | 202 | 200 | 199 |
| 15 | 194 | 191 | 190 | 191 |
| 5 | 184 | 181 | 181 | 183 |
Grade 7
| Percentile | Math | Reading | Language Usage | Science |
|---|---|---|---|---|
| 95 | 246 | 240 | 236 | 230 |
| 85 | 235 | 230 | 226 | 221 |
| 65 | 224 | 219 | 216 | 212 |
| 50 (median) | 217 | 212 | 210 | 207 |
| 35 | 211 | 206 | 204 | 202 |
| 15 | 199 | 195 | 194 | 193 |
| 5 | 189 | 185 | 184 | 185 |
Grade 8
| Percentile | Math | Reading | Language Usage | Science |
|---|---|---|---|---|
| 95 | 252 | 244 | 239 | 233 |
| 85 | 241 | 233 | 230 | 224 |
| 65 | 229 | 222 | 220 | 215 |
| 50 (median) | 222 | 216 | 214 | 210 |
| 35 | 215 | 209 | 208 | 204 |
| 15 | 203 | 198 | 197 | 195 |
| 5 | 192 | 188 | 188 | 186 |
Grade 9
| Percentile | Math | Reading | Language Usage | Science |
|---|---|---|---|---|
| 95 | 254 | 246 | 241 | 233 |
| 85 | 243 | 235 | 231 | 225 |
| 65 | 232 | 223 | 220 | 217 |
| 50 (median) | 225 | 216 | 214 | 212 |
| 35 | 218 | 209 | 208 | 207 |
| 15 | 207 | 197 | 197 | 198 |
| 5 | 196 | 186 | 187 | 190 |
Grade 10
| Percentile | Math | Reading | Language Usage | Science |
|---|---|---|---|---|
| 95 | 257 | 247 | 244 | 235 |
| 85 | 246 | 236 | 234 | 227 |
| 65 | 234 | 225 | 222 | 218 |
| 50 (median) | 227 | 218 | 216 | 213 |
| 35 | 220 | 211 | 209 | 208 |
| 15 | 208 | 199 | 198 | 200 |
| 5 | 196 | 188 | 188 | 191 |
Grade 11
| Percentile | Math | Reading | Language Usage |
|---|---|---|---|
| 95 | 263 | 248 | 246 |
| 85 | 250 | 237 | 235 |
| 65 | 234 | 225 | 224 |
| 50 (median) | 229 | 218 | 218 |
| 35 | 221 | 211 | 211 |
| 15 | 208 | 199 | 200 |
| 5 | 195 | 188 | 189 |
Grade 12
| Percentile | Math | Reading |
|---|---|---|
| 95 | 263 | 249 |
| 85 | 250 | 237 |
| 65 | 236 | 225 |
| 50 (median) | 228 | 218 |
| 35 | 220 | 210 |
| 15 | 206 | 198 |
| 5 | 194 | 187 |
Norms reflect the pre-2025-update reference group commonly cited by test-prep resources; treat exact percentile labels as approximate under the 2025 refresh described above, and check your official school report for the precise current mapping.
How to Improve Map Testing Scores
To boost map testing scores and align with map scores by grade level 2026 goals, follow these strategies:
1. Target Weak Areas
Use map testing scores reports to identify gaps (e.g., a 4th grader with a 192 RIT in math may need extra practice in algebra). Focus on skill-specific drills (e.g., fractions, geometry) rather than general review.
2. Practice with Adaptive Tools
MAP is an adaptive test, so practice with adaptive resources (e.g., NWEA’s MAP Growth practice tests) to build familiarity with question difficulty shifts.
3. Create a Study Schedule
Break study sessions into 20–30 minute blocks (e.g., 3x/week for math) and track progress against map scores by grade level 2026 benchmarks. Celebrate small wins (e.g., a +5 RIT increase).
4. Collaborate with Teachers
Ask educators for personalized resources (e.g., worksheets, apps) tailored to your child’s map testing scores gaps. Teachers can also explain how to align practice with grade-level standards.
FAQs About Map Test Scoring Charts:
Through the school/district family portal, a parent-teacher conference, or by requesting the Family Report from the school's testing coordinator.
No — only the percentile comparison group changed. The RIT scale and how RIT is calculated are unchanged.
The RIT scale tops out around 350, though scores that high are extremely rare even in advanced high schoolers. Focus on growth over an absolute ceiling.
Generally the 95th percentile RIT value or higher for the student's grade and subject (see table above), though district cutoffs vary.
Discovering the maths whiz in every child,
that's what we do.
Suitable for students worldwide, from grades K-12.
Get started free!
Graduated from Columbia University in the United States and has rich practical experience in mathematics competitions’ teaching, including Math Kangaroo, AMC 8… He teaches students the ways to flexible thinking and quick thinking in sloving math questions, and he is good at inspiring and guiding students to think about mathematical problems and find solutions.


![Can You Take the SAT After High School? 2026 Adult Test-Taker Guide [No Age Limit]](https://wp-more.wukongedu.net/blog/wp-content/uploads/2025/11/生成封面图-10-520x293.png "Can You Take the SAT After High School? 2026 Adult Test-Taker Guide [No Age Limit]")


Comments0
Comments