
Variance Formula| Population and Sample Variance


Variance is a fundamental statistical measure that quantifies the degree of spread in a dataset. In statistics, variance is defined as a measure of dispersion, reflecting how much individual data points differ from the mean.
Variance tells you the degree of spread or variability within a dataset, indicating how much the data points differ from the mean.
A low variance indicates that data points are clustered closely around the mean, while a high variance shows that they are widely dispersed. In essence, variance provides valuable insights into the variability and consistency of data.
Discovering the maths whiz in every child,
that’s what we do.
Suitable for students worldwide, from grades 1 to 12.
Get started free!Formula
The formula for variance is essential in statistics for measuring how data points spread around the mean. Understanding the formula for variance helps in quantifying variability in both populations and samples.
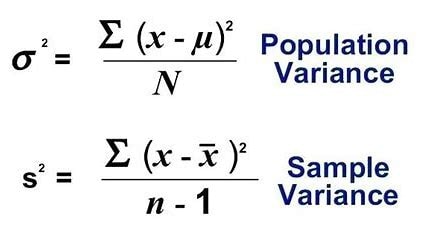
There are two main formulas: the population variance formula and the sample variance formula. The population variance formula is used when you have data for every individual in the population, while the sample variance formula is used when you have a subset (sample) of the population.
In both formulas, x i (written as x_i) represents each individual data value. The calculation involves finding the difference between each data point (x i) and the mean, squaring that difference, summing all squared differences, and then dividing by the appropriate denominator.
| Population Variance Formula | Sample Variance Formula |
|---|---|
| σ² = Σ(x_i – μ)² / N | s² = Σ(x_i – x̄)² / (n – 1) |
Where:
- μ = population mean
- x̄ = sample mean
- N = population size
- n = sample size
- x i = individual data points
Key Elements in the Formula
- Squared Differences: The squared deviations from the mean ensure that all differences are positive, allowing for averaging.
- Sum: The sum of squared differences aggregates the total variability.
- Division: Dividing by N (population) or n – 1 (sample) provides the average variability.
The calculated variance represents the average squared deviation from the mean.
Population Variance
Population variance (σ²) measures the dispersion of all data points in a population relative to the population mean. When data from the whole population is available, population variance is used to accurately assess data dispersion. It is calculated using the formula:
σ² = Σ(x_i – μ)² / N
Example Calculation
This section provides examples of how to calculate population variance.
| Data Values (x_i) | Mean (μ) | Deviation (x_i – μ) | Squared Deviation (x_i – μ)² |
|---|---|---|---|
| 10 | 15 | -5 | 25 |
| 15 | 15 | 0 | 0 |
| 20 | 15 | 5 | 25 |
| Total | 50 |
Population Variance (σ²) = 50 / 4 = 12.5
Sample Variance
Sample variance (s²) estimates the dispersion of a sample relative to the sample mean. When calculating sample variance, you subtract the sample mean from each data point, square the result, sum these squared differences, and then divide by n – 1 to provide an unbiased estimate of the population variance.
s² = Σ(x_i – x̄)² / (n – 1)
Example Calculation
This section demonstrates how to calculate the variance for a sample.
| Sample Data (x_i) | Mean (x̄) | Deviation (x_i – x̄) | Squared Deviation (x_i – x̄)² |
|---|---|---|---|
| 10 | 15 | -5 | 25 |
| 15 | 15 | 0 | 0 |
| 20 | 15 | 5 | 25 |
| Total | 50 |
Sample Variance (s²) = 50 / (3) = 16.67
Random Variable
A random variable is a variable whose possible values are outcomes of a random phenomenon. There are two main types:
| Type | Description |
|---|---|
| Discrete Random Variable | Takes on a countable number of distinct values, such as the number of heads in coin flips. |
| Continuous Random Variable | Takes on an uncountable number of values within a range, such as the height of individuals. |
Variance measures the spread or variability for one variable, while covariance is used to describe the relationship between two random variables.
Standard Deviation
Standard deviation is the positive root of the variance. It measures spread in the same units as the original data. For population standard deviation (σ) and sample standard deviation (s):
σ = √σ²
s = √s²
Comparison of Variance and Standard Deviation
| Measure | Units | Interpretation |
|---|---|---|
| Variance | Squared units | Reflects spread in squared terms; units differ from the original data. |
| Standard Deviation | Same as original data | Reflects spread in the same units as data; units differ from variance, making interpretation more intuitive. |
Independent Random Variables
Independent random variables are variables whose outcomes do not influence each other. The variance of the sum of independent random variables is the sum of their variances.
Var(X + Y) = Var(X) + Var(Y)
Probability Distribution
A probability distribution describes the likelihood of each possible value of a random variable. For continuous random variables, the probability distribution is represented by a probability density function, often denoted as f(x). Common distributions include the normal distribution and binomial distribution.
Normal Distribution
- Symmetric, bell-shaped curve.
- Mean, median, and mode are equal.
- Variance determines the spread.
Binomial Distribution
- Models the number of successes in a fixed number of trials.
- Parameters: number of trials (n) and probability of success (p).
- Variance = np(1-p)
Expected Value
The expected value (E[X]) of a random variable is the long-run average value of repetitions of the experiment it represents.
For a discrete random variable:
E[X] = Σx_i * P(x_i)
Data Values and Sample Data
Data values are the individual observations in a dataset. Data sets are collections of data values used in statistical analysis. Sample data refers to a subset of the population used for analysis.
Example Dataset
| Data Point (x_i) | Sample Data Set |
|---|---|
| 5 | Included |
| 10 | Included |
| 15 | Included |
| 20 | Included |
| 25 | Included |
Squared Deviations and Formula Mentioned
Squared deviations are the differences between each data point and the mean, each raised to the power of x 2 (that is, squared). They are a key component of the variance formula.
Calculation Steps
- Calculate the mean.
- Subtract the mean from each data point.
- Square each deviation.
- Sum the squared deviations.
- Divide by N (population) or n – 1 (sample).
Units and Interpretation
Variance is in squared units of the original data. This can make interpretation challenging. Standard deviation, being in the same units as the data, is often preferred for interpretation.
Example Units
| Data Unit | Variance Unit | Standard Deviation Unit |
|---|---|---|
| Meters (m) | Meters squared (m²) | Meters (m) |
| Seconds (s) | Seconds squared (s²) | Seconds (s) |
Variance Calculator
A variance calculator is a tool that automates the calculation of variance. It requires inputting the dataset and specifies whether it’s a population or sample.
Basic Properties
Variance has several key properties:
- Non-negative: Variance is always ≥ 0.
- Scale-dependent: Changes in data scale affect variance.
- Additivity for Independent Variables: Var(X + Y) = Var(X) + Var(Y) if X and Y are independent.
Low vs. High Variance
| Variance Level | Characteristics | Implications |
|---|---|---|
| Low Variance | Data points are close to the mean. | Indicates consistency and predictability. |
| High Variance | Data points are widely dispersed. | Indicates variability and uncertainty. |
Sample Size and Variance
Sample size affects the calculation of sample variance. Larger samples provide more reliable estimates of population variance. When comparing variances between different populations, it is important to carefully consider sample size to ensure accurate statistical analysis.
Sample Size Impact
| Sample Size (n) | Effect on Variance Estimate |
|---|---|
| Small | Less reliable, higher variability. |
| Large | More reliable, lower variability. |
How to Calculate Variance
Step-by-Step Guide
- Calculate the Mean: Sum all data points and divide by the number of points.
- Find Deviations: Subtract the mean from each data point.
- Square Deviations: Square each deviation to eliminate negatives.
- Sum Squared Deviations: Add up all squared deviations.
- Divide: Divide by N for population or n - 1 for sample.
Example of Variance
Consider a dataset: 8, 12, 10, 14, 16.
Calculation Table
| Data Point (x_i) | Mean (x̄) | Deviation (x_i - x̄) | Squared Deviation (x_i - x̄)² |
|---|---|---|---|
| 8 | 12 | -4 | 16 |
| 12 | 12 | 0 | 0 |
| 10 | 12 | -2 | 4 |
| 14 | 12 | 2 | 4 |
| 16 | 12 | 4 | 16 |
| Total | 40 |
Sample Variance (s²) = 40 / (5 - 1) = 10
Problem & Solution
Problem
A researcher collects a sample of exam scores: 78, 82, 85, 88, 90. Calculate the sample variance.
Solution
- Calculate the Mean: (78 + 82 + 85 + 88 + 90)/5 = 84.6
- Find Deviations:
- 78 - 84.6 = -6.6
- 82 - 84.6 = -2.6
- 85 - 84.6 = 0.4
- 88 - 84.6 = 3.4
- 90 - 84.6 = 5.4
- Square Deviations:
- (-6.6)² = 43.56
- (-2.6)² = 6.76
- (0.4)² = 0.16
- (3.4)² = 11.56
- (5.4)² = 29.16
- Sum Squared Deviations: 43.56 + 6.76 + 0.16 + 11.56 + 29.16 = 91.2
- Calculate Sample Variance: 91.2 / (5 - 1) = 22.8
Points to Remember
- Variance measures the dispersion of data points from the mean.
- High variance indicates greater variability in the data.
- Variance is in squared units of the original data.
- Standard deviation is the square root of variance and shares the same units as the data.
- The variance formula differs between population and sample calculations.
- Variance is non-negative and sensitive to outliers.
Frequently Asked Questions – FAQs
what is sample variance formula?
The sample variance formula is: s² = Σ(x_i - x̄)² / (n - 1). Here, x_i represents each data point, x̄ is the sample mean, and n is the sample size. This formula calculates the average of the squared differences from the mean, providing a measure of data spread.
What is the symbol of variance?
The symbol for population variance is σ² (sigma squared), and for sample variance, it is s².
What is the formula to find variance?
The formula for population variance is σ² = Σ(x_i - μ)² / N, and for sample variance, it is s² = Σ(x_i - x̄)² / (n - 1). Here, μ represents the population mean, x̄ represents the sample mean, N is the population size, and n is the sample size.
How to find the variance easily?
Follow these steps to find variance easily:
- Calculate the mean of the dataset.
- Subtract the mean from each data point to find the differences.
- Square each of these differences.
- Sum all the squared differences.
- Divide by N for population variance or by (n - 1) for sample variance.
What is the relation between variance and standard deviation?
Standard deviation is the positive square root of variance. While variance measures spread in squared units, standard deviation measures it in the same units as the original data, making it more interpretable.
Summary Table of Key Terms
| Term | Description |
|---|---|
| Variance | Measure of data spread from the mean. |
| Population Variance | Variance calculated for an entire population. |
| Sample Variance | Variance calculated for a sample, using n - 1 in the denominator. |
| Random Variable | A variable whose possible values are outcomes of a random phenomenon. |
| Standard Deviation | The square root of variance, in the same units as the data. |
| Independent Random Variables | Variables whose outcomes do not influence each other. |
| Expected Value | The long-run average value of a random variable. |
| Probability Distribution | Describes the likelihood of each possible value of a random variable. |
| Squared Deviations | Squared differences between data points and the mean. |
| Normal Distribution | Symmetric, bell-shaped distribution characterized by mean and variance. |
| Binomial Distribution | Models the number of successes in a fixed number of independent trials. |
Conclusion
Variance is a critical tool in statistics for understanding data spread and variability. Whether analyzing a population or a sample, the variance formula provides valuable insights into how data points are distributed around the mean. By mastering the concepts and calculations related to variance, you can better interpret data and make informed decisions in various fields, from science and engineering to business and social sciences. If you want to learn more about math, you can click on the link below, and Wukong Education will continue to accompany you in your studies. The WuKong Math classes integrate visual modeling and structured strategies to promote kids' deeper understanding and creative thinking.
Discovering the maths whiz in every child,
that's what we do.
Suitable for students worldwide, from grades 1 to 12.
Get started free!
Nathan, a graduate of the University of New South Wales, brings over 9 years of expertise in teaching Mathematics and Science across primary and secondary levels. Known for his rigorous yet steady instructional style, Nathan has earned high acclaim from students in grades 1-12. He is widely recognized for his unique ability to blend academic rigor with engaging, interactive lessons, making complex concepts accessible and fun for every student.

?")


")


![Stanford Math Tournament: Registration, Date, Past Papers & Answers [2025 Guide]](https://wp-more.wukongedu.net/blog/wp-content/uploads/2024/04/image-1-520x293.jpeg "Stanford Math Tournament: Registration, Date, Past Papers & Answers [2025 Guide]")


![Demystifying the Wechsler IQ Test: An In-Depth Guide [2025 Updated]](https://wp-more.wukongedu.net/blog/wp-content/uploads/2024/01/image-72-520x293.jpeg "Demystifying the Wechsler IQ Test: An In-Depth Guide [2025 Updated]")


Comments0
Comments