
Proportional Relationship-7 Grade Math


Proportional relationships are fundamental in mathematics and have wide-ranging applications in various fields. Understanding these relationships enables us to analyze how quantities interact and predict outcomes based on given data. Students can observe proportional relationships in action through practical examples, enhancing their problem-solving skills.
Recognizing the importance of these relationships is crucial in the learning process, making it easier to grasp complex concepts. WuKong Education explores proportional relationships in tables, on graphs, and in real-world scenarios, providing clear explanations, examples, and insights to help you grasp this essential concept effectively in math education.
Proportional Relationships in Tables
- Understanding the Basics
- In a table, a proportional relationship is represented by two variables where the ratio between the dependent variable (y) and the independent variable (x) remains constant. This constant ratio is known as the constant of proportionality (k), and the relationship can be expressed as y = kx.
- For example, consider a table showing the distance traveled by a car at a constant speed. If the car travels 60 miles in 1 hour, 120 miles in 2 hours, and 180 miles in 3 hours, the ratio of distance to time is consistently 60 miles per hour. This consistent ratio indicates a proportional relationship, highlighting the significance of numbers in establishing these relationships.
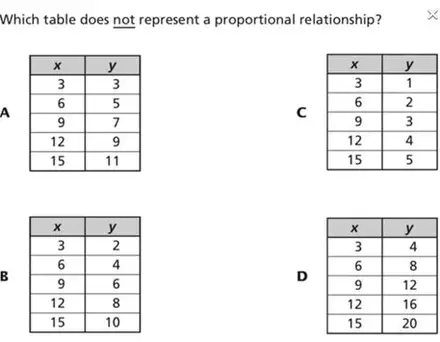
- Identifying Proportional Relationships in Tables
- To determine if a table exhibits a proportional relationship, check if the ratio of y to x is equal for all pairs of values. Each row in the table should be examined to ensure the ratios remain consistent. This ratio, called the unit rate, should remain unchanged.
- Additionally, when the independent variable (x) is zero, the dependent variable (y) should also be zero. This is why the graph of a proportional relationship passes through the origin (0, 0).
Proportional Relationships on Graphs
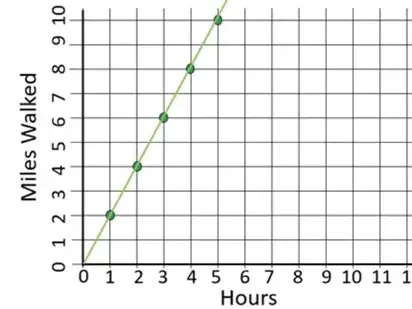
- Graphical Representation
- On a graph, a proportional relationship is depicted by a straight line that passes through the origin, which can be represented by an equation. Plotting points on the graph is crucial to visualize these proportional relationships. The steepness of this line, or its slope, represents the constant of proportionality (k). A steeper slope indicates a larger k value, meaning the dependent variable increases more rapidly with respect to the independent variable when multiplied times the constant.
- For instance, plotting the cost of apples against the number of pounds purchased, if the points form a straight line through the origin, the cost is proportional to the weight. The slope of this line corresponds to the price per pound of apples.
- Interpreting Graphs
- Equivalent ratios in a proportional relationship translate to collinear points on the graph. Each point on the line represents a pair of values that maintain the same ratio, reinforcing the idea of constant proportionality.
- If the line doesn’t pass through the origin, the relationship isn’t proportional. This might occur if there’s a fixed cost added regardless of the quantity purchased, which would shift the line upward.
Proportional Relationships in the Real World

- Everyday Applications
- Proportional relationships are prevalent in everyday life. For example, when planning a road trip, the number of gallons of gas needed is proportional to the distance traveled if the car consumes gas at a constant rate. Similarly, when shopping, knowing the unit price of an item allows you to calculate the total cost for different quantities of money spent.
- Filling a gas tank illustrates proportional relationships, as the amount of fuel filled directly relates to the amount of money spent.
- In a business context, understanding proportional relationships helps in setting prices, predicting revenue, and managing resources. A company might determine that the cost of producing a product is proportional to the number of units produced, enabling accurate expense and profit forecasting. The amount of money it takes to fill the tank varies based on the price per gallon and the quantity of gas, emphasizing the direct relationship between these two factors.
- Other Real-World Examples
- In fields like science and engineering, proportional relationships are fundamental. They help researchers model natural phenomena, design structures, and solve complex problems by establishing relationships between variables such as force, distance, time, and more.
- For example, in physics, the relationship between force and acceleration is proportional (Newton’s second law: F = ma), where mass (m) is the constant of proportionality.
Key Concepts and Skills Related to Proportional Relationships

- Identifying Variables
- Distinguishing between independent and dependent variables is crucial. The independent variable is the one that is controlled or manipulated, while the dependent variable responds to changes in the independent variable.
- Calculating Ratios and Unit Rates
- Being able to compute and compare ratios helps in determining whether a relationship is proportional. Unit rates provide a common basis for comparison by expressing ratios in terms of a single unit of the independent variable.
- Interpreting Graphs
- Reading and creating graphs that represent proportional relationships enhances visual understanding and enables quick analysis of how variables interact.
- Solving Word Problems
- Applying proportional relationship concepts to real-world situations requires translating problem descriptions into mathematical expressions and equations, then solving them to find desired values. Finding solutions to these word problems is essential for mastering the application of proportional relationships.
- Recognizing Equivalent Ratios
- Understanding that different pairs of values can represent the same proportional relationship through equivalent ratios strengthens the ability to identify and work with these relationships in various forms.
- Using Precise Terminology
- Using precise words to describe proportional relationships is important for clear communication and understanding. This includes articulating the constant of proportionality and providing relatable examples to clarify the concept.
FAQ About Proportional Relationship
What is an example of a proportion in everyday life?
Proportion is an equation that defines that the two given ratios are equivalent to each other. For example, the time taken by train to cover 100km per hour is equal to the time taken by it to cover the distance of 500km for 5 hours. Such as 100km/hr = 500km/5hrs.
What is a proportional relationship in word problems?
What are Proportional Relationships? When two different values have ratios that are equivalent to one another, we say that a proportional relationship exists between these two variables.
Conclusion
Proportional relationships are a vital mathematical tool that enables us to make sense of the connections between quantities in diverse contexts. By studying these relationships in tables, graphs, and real-world scenarios, we gain valuable insights and problem-solving abilities that extend far beyond the classroom. As you continue to explore and practice working with proportional relationships, you’ll become more adept at recognizing their presence and leveraging their properties to navigate the quantitative aspects of everyday life and various professional fields. So, embrace the challenge of practice problems and watch as your understanding of proportional relationships deepens and expands. WuKong Math classes help you open doors to a more mathematically literate and confident you.
Discovering the maths whiz in every child,
that’s what we do.
Suitable for students worldwide, from grades 1 to 12.
Get started free!
I am an educator from Yale University with ten years of experience in this field. I believe that with my professional knowledge and teaching skills, I will be able to contribute to the development of Wukong Education. I will share the psychology of children’s education and learning strategies in this community, hoping to provide quality learning resources for more children.

?")


 2026: Complete Guide")
")


![40 Celsius to Fahrenheit, 40°C to °F Conversion [Solved]](https://wp-more.wukongedu.net/blog/wp-content/uploads/2024/12/image-8-520x293.png "40 Celsius to Fahrenheit, 40°C to °F Conversion [Solved]")

![Quick Conversion: How Many Seconds in an Hour? [with an easy-use calculator]](https://wp-more.wukongedu.net/blog/wp-content/uploads/2024/10/image-36-520x293.png "Quick Conversion: How Many Seconds in an Hour? [with an easy-use calculator]")

")


Comments0
Comments